Government of the Republic of Serbia

Overall Economic Context
Macroeconomic trends in 2021 are more favourable than the results achieved in 2020, which is defined by weaker indicators of achieved goals in the country due to the consequences of the COVID-19 pandemic. The Fiscal Council of the Republic of Serbia estimates the real GDP growth rate in 2021 at 6.0%, which is significantly above the achieved GDP growth rate in 2020 (-1.0%), and also above the GDP growth rate in 2019, which was 4.2%. The average inflation in 2019 was slightly lower than planned, 1.9% instead of the planned 2.3%. The current deficit of the balance of payments is 6.9% (instead of the planned 5.2%, which was the forecast made by the Government at the end of 2018). Furthermore, trends in the labour market are improving (gradual increase in employment and average salary)[1]. In 2019, the only important macroeconomic indicator that was more favourable than its forecast relates to the labour market, where wages have a relatively high growth of over 9% (real 7%) with employment growth of 2%[2].
The Republic of Serbia finished 2019 with a real economic growth of 4.2%[3]. After 2014, when a real decrease of 1.6% occurred, the Serbian economy has shown signs of moderate recovery (achieving an economic growth of 1.8% in 2015, 3.3% in 2016, 2.0% in 2017, and 4.4% in 2018).
According to forecasts presented in the Fiscal Strategy for 2021 with Projections for 2022 and 2023, and the Economic Reform Programme (ERP) for the period 2021-2023[4], a recovery is expected with a growth rate of 6.0% in 2021 and then a period of unchanging growth rate of 4.0% in 2022 and 2023.
The Government has undertaken certain steps to resolve the numerous obstacles impeding growth. A new three-year programme of fiscal consolidation was started in late 2014, envisaging budget savings and comprehensive structural reform. The fiscal consolidation measures have reduced public expenditures and moderately increased tax revenues with changes to their structure, implying changes to the structure of aggregate demand. The Progress Report for 2019 by the EC notes that the chosen combination of macroeconomic policies was correct and led to macroeconomic stability and improvements in the key economic indicators. Although there are still significant economic challenges, the main being that economic growth is slow, the restrictive fiscal policy and adaptable monetary policy have ensured price stability, stimulated investment activities, increased employment and reduced the risk premium for the country. As in previous years, continued economic reforms and their full implementation remain crucial for further strengthening of the economic potential and for the support to the real convergence with the EU.
After the successfully completed precautionary stand-by arrangement during the period 2015-2017, in July 2018 the Executive Board of the International Monetary Fund (IMF) approved a new 30-month cooperation programme for Serbia, the Policy Coordination Instrument (PCI). It has an advisory character and does not envisage the use of funds. The goal of the instrument is sustaining macroeconomic and financial stability and a continuation of structural and institutional reform to stimulate faster and more comprehensive growth, the creation of new jobs and improvement of living standards. After the IMF mission for discussions on the first audit of the arrangement under the Policy Coordination Instrument (PCI) in October 2018, it was concluded that further progress was achieved in the implementation of structural reform, but that additional efforts are required to maintain the high growth date during coming years[5].
The main goals and guidelines of the economic policy of the Republic of Serbia have been recognized in the Fiscal Strategy for 2019 with Projections for 2020 and 2021:
- Maintenance of fiscal stability with support for growth;
- Macroeconomic sustainable and inclusive growth of the economy; and
- EU accession process.
Fiscal trends in late 2019 show a deficit of the consolidated state sector of 0.2% of the GDP[6]. The draft Fiscal Strategy envisages the stabilization of public finances, following the crises caused by the COVID-19 pandemic in 2020 and 2021. The planned fiscal deficit in 2021 is about 7% of the GDP, while in the coming years it is expected to decrease to 3% of the GDP (in 2022), and 1% of the GDP (2024). Due to fiscal consolidation measures, a fiscal space was created for new policies, which will be used in the coming years to increase public investments in order for them to stay at a very high level of over 6% of the GDP, with controlled increase of pensions and salaries in part of the public sector, and reduction of taxes on revenues. These measures and their fiscal implications have been designed so as not to endanger the stability of public finance and the tempo of decrease of foreign debt, while on the other hand they should increase the living standard of the population, stimulate private spending and accelerate economic development.
An additional goal of the fiscal policy for the coming period is a further decrease in the share of public debt in the GDP. The trajectory of public debt was overturned in 2016, when the share of public debt in the GDP started to decrease. The public debt of the central level of the government on 31 December 2017 was 58.7%, whereas one year later it was 54.0% of the GDP[7]. The public debt in the Republic of Serbia in 2019 was 52.0% of the GDP. A reduction of the share of debt is tightly linked to decreasing the deficit as the main debt factor, so that the dynamics of decreasing the deficit are also decisive for changes to the debt trend. Financial transactions, such as the exchange of an expensive debt for a cheaper one, and an improved positioning of the state in the international financial market, may also contribute to further decreases in debt.
Inter-annual inflation[8] has been reduced from 7.8% in 2013 to 2.0% in 2018, i.e., 1.9% in 2019. These trends are keeping inflation below the lower limit of permitted deviations from the goal (3±1.5%).
Macroeconomic trends
| 2012 | 2013 | 2014 | 2015 | 2016 | 2017 | 2018 | 2019 | |
| GDP, EUR bln | 33.7 | 36.4 | 35.4 | 35.7 | 36.7 | 39.1 | 42.8 | 45.9 |
| GDP, per capita, EUR | 4,676 | 5,082 | 4,973 | 5,034 | 5,203 | 5,581 | 6,137 | 6,619 |
| GDP, real growth in % | -0.7 | 2.9 | -1.6 | 1.8 | 3.3 | 2.0 | 4.4 | 4.2 |
| Inflation, growth rate in %, period average | 7.8 | 7.8 | 2.9 | 1.9 | 1.2 | 3.0 | 2.0 | 1.9 |
| RSD/EUR exchange rate, period average | 113.1 | 113.1 | 117.3 | 120.7 | 123.1 | 121.3 | 118.2 | 117.8 |
| Current account deficit, % GDP | -10.9 | -5.8 | -5.6 | -3.5 | -2.9 | -5.2 | -4.8 | -6.9 |
| Foreign direct investments, net % GDP | 2.2 | 3.6 | 3.5 | 5.1 | 5.2 | 6.2 | 7.4 | 7.8 |
| NBS reserves, EUR bln | 10.9 | 11.2 | 9.9 | 10.4 | 10.2 | 9.9 | 11.2 | 13.4 |
| Consolidated fiscal deficit, % GDP | -6.4 | -5.1 | -6.2 | -3.5 | -1.2 | 1.1 | 0.6 | -0.2 |
| Public debt, % GDP | 54.6 | 57.5 | 67.5 | 71.2 | 68.8 | 58.7 | 54.0 | 52.0 |
Source: MF, SORS, NBS
For more information on economic developments in Serbia, see:
- The Third National Report on Social Inclusion and Poverty Reduction in the Republic of Serbia for the Period 2014–2017
- Macroeconomic data from the Ministry of Finance
- Statistics by the National Bank of Serbia
- Evaluation of the Fiscal Policy by the Fiscal Council
- Quarterly Monitor of Economic Trends and Policies in Serbia
Overall Social Context
On 30 June 2019[9] a total of 6,945,235 persons lived in the Republic of Serbia. In a demographic sense, Serbia is characterized by an expressed depopulation trend (the Republic of Serbia lost 185,415 persons during the period between 1 January 2014 and 1 January 2019), low fertility[10], relatively high (in an European framework) specific mortality rate, high average population age (43.3 years) and unfavourable age structure.
The year 2019 was the twenty-eighth year in a row marking negative population growth in the Republic of Serbia. Observed relatively across a population of one thousand, the population growth rate was -5.4‰. The true scale of the negative population growth can be analysed at the municipal level.
The trend of increase in life expectancy at birth for both sexes has continued. The achieved value of this indicator was 78.3 years for women and 73.1 years for men in 2019[11]. Despite the achieved historical maximum, life expectancy in the Republic of Serbia is more than five years shorter than the EU average. The dependence index of the elderly population[12] in 2019 was 31.8%, with projections of achieving the value of 36.3% in 2041.
Rough estimates based on data from different sources indicate an average annual negative balance of external migration of at least 16,000 persons (data from countries most frequently receiving migrants from the Republic of Serbia, the Statistical Office of the Republic of Serbia and the Commissariat for Refugees and Migrations)[13].
Trends in salaries and pensions during the period 2014-2019 were under the influence of the measures of fiscal consolidation and the overall macroeconomic situation in the country. Pensions and salaries in the public sector have registered a sharp real decline during the first two years of the observed period, a slight growth in 2016, and another real decline during 2017, and then a slight growth in 2018 and 2019. The increase of the real amount of net salaries in 2019 compared to 2018 was 8.4%[14]. However, it should be noted that there was an interruption of the time series in 2018. In absolute amounts, the average net earnings in 2019 were RSD 54,919 (EUR 466), and the average pension RSD 26,343 (EUR 223).
According to data from the Labour Force Survey[15], employment in the Republic of Serbia during 2019 has increased by 68,100 (+2.4%). The decrease of the unemployment rate, started in 2013, was continued in 2019. The unemployment rate in 2019 was 10.4%, representing a decrease of 2.3 percentage points (p.p.) compared to 2018. The increase of employment and decrease of unemployment in 2019 was also followed by a slight decrease of inactivity. The inactivity rate was 45.4%, which is slightly less than 2018 when the inactivity rate was 45.5%.
Key labour market indicators 2012-2019 (working-age population 15-64)
| 2012 | 2013 | 2014 | 2015 | 2016 | 2017 | 2018 | 2019 | |||||||||
| Total | Female | Total | Female | Total | Female | Total | Female | Total | Female | Total | Female | Total | Female | Total | Female | |
| Activity rate | 60.1 | 51.2 | 61.6 | 53.2 | 61.7 | 53.8 | 63.4 | 55.5 | 65.6 | 58.1 | 66.7 | 59.6 | 67.8 | 60.6 | 68.1 | 61.3 |
| Employment rate | 45.3 | 38.1 | 47.5 | 40.1 | 49.6 | 42.8 | 51.7 | 44.7 | 55.2 | 48.4 | 57.3 | 50.8 | 58.8 | 52.0 | 60.7 | 54.3 |
| Unemployment rate | 24.6 | 25.6 | 23.0 | 24.6 | 19.7 | 20.4 | 18.5 | 19.5 | 15.9 | 16.7 | 14.1 | 14.8 | 13.3 | 14.2 | 10.9 | 11.5 |
Source: FS respective years, SORS
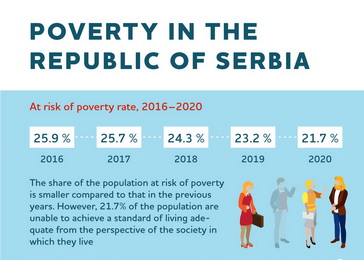
Poverty remained significant, both expressed in absolute terms (the share of people whose consumption is below the threshold required to meet basic needs – 7.0% in 2019[16]), and in relative terms (the share of people at risk of poverty stood at 23.2%[17] in 2018). Regardless of the methodological concept applied, the profile of the poor does not differ significantly according to the concept of absolute poverty or relative poverty. Judging by the profile of the poor, the living standard is decisively influenced by the following elements: employment status, education attainment, household size and type (households consisting of a single parent with several children are particularly vulnerable) and residence outside urban areas[18].
The at-risk-of-poverty-or-social-exclusion (AROPE) rate, the key monitoring indicator for the Europe 2020 strategy, is at 31.7% in Serbia[19] in 2019. This value is significantly higher than the average value for the EU 28 countries (21.4%). A higher percentage of population at risk of poverty or social exclusion than in the Republic of Serbia has been registered in Bulgaria, Albania, North Macedonia and Turkey[20].
The at-risk-of-poverty rate by the most frequent activity status on the labour market (held for more than six months) shows that the unemployed are in the worst situation (47.5% or almost one out of two unemployed people is at risk of poverty). Employment reduces the risk of poverty considerably, but quality of employment remains the key factor for exiting poverty (the self-employed have a significantly higher at-risk-of-poverty rate than those in dependent employment – 25.9% and 6.5% respectively). After those in dependent employment, pensioners are in the most favourable position, with the risk of poverty approximately equal to that of total employed people (17.2%). Education is a decisive factor for the economic status and income-generating capacity; it is, therefore, not surprising that people with lower educational attainment levels are at an above-average risk of poverty. In 2019, the highest at-risk-of-poverty rate was recorded among the population with primary education and below (41.1%), while the population with college or university education had the lowest at-risk-of-poverty rate (6.1%). This distribution of the population at risk of poverty by educational attainment level clearly indicates that education is worthwhile, given that the highly educated are rewarded in the labour market.
Even though consumption inequality measured by the Household Budget Survey (HBS) indicates that Serbia can be classified among countries with an even distribution (the Gini coefficient stood at 27.53 in 2019), the values obtained through a comparable methodology (SILC) point to a highly pronounced problem of income distribution inequality (Gini 33.3). Part of the explanation for differences in the values of the Gini coefficient based on the two surveys are due to the SILC survey in Serbia registering negative values of income for self-employed persons, while the HBS survey does not record losses[21].
Income distribution inequality measured by another indicator – income quintile share ratio – stood at 6.46, which means that in 2019 the equalised income of the richest 20% in the Republic of Serbia was nearly 6 times higher than that of the poorest 20%. The value of this indicator measured in recent years was substantially higher than the average for the 28 EU Member States, amounting to just 5.09, but also lower than the highest values registered in Bulgaria (8.10), Romania (7.08) and Lithuania (6.54)[22].
—————