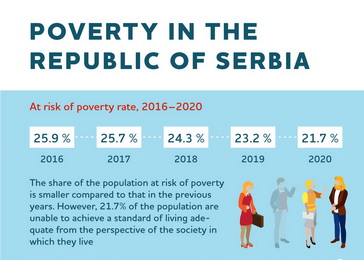
Poverty in Serbia is monitored and reported on under two methodological concepts for measuring poverty (the concepts of absolute and relative poverty). Absolute poverty represents the inability to meet the minimum, basic needs, while relative poverty entails the inability to achieve a standard of living adequate from the perspective of the society in which an individual lives.
Although assessments of the population’s financial status and living standard are performed by applying different methodological concepts, with ongoing improvements to the methodology and indicators, it is noteworthy that there are no significant differences between the profiles of the poor under the absolute and relative poverty concepts. Data show that the most vulnerable population includes:
- Children up to the age of 14,
- Youth (15–24),
- Multi-person households,
- Non-urban population,
- Persons living in households where the heads of the household have a low education level,
- Persons living in households where the heads of the household are unemployed or outside the labour market.
The key poverty risk factors are:
- Education (complete or incomplete primary education),
- Labour market status (unemployed/inactive),
- Household size (five-person and larger households),
- Place of permanent residence (non-urban area, Eastern/South-Eastern Serbia), and
- Age (children and youth).
A specific focus on these population categories is required when designing social policy measures.
Absolute poverty rates of the most vulnerable groups, 2006–2019, %
| 2006 | 2007 | 2008 | 2009 | 2010 | 2011 | 2012 | 2013 | 2014 | 2015 | 2016 | 2017 | 2018 | 2019 | |
| Total population – average for the Republic of Serbia | 8.8 | 8.3 | 6.1 | 6.6 | 7.6 | 6.6 | 6.3 | 7.4 | 7.6 | 7.4 | 7.3 | 7.2 | 7.1 | 7.0 |
| Non-urban areas | 13.3 | 11.2 | 7.5 | 9.0 | 12.1 | 9.4 | 8.7 | 10.5 | 10.9 | 10.5 | 10.5 | 10.5 | 10.4 | 10.3 |
| Region of Southern and Eastern Serbia | 11.4 | 10.7 | 10.7 | 15.0 | 15.5 | 11.3 | 11.8 | 14.7 | 13.5 | 13.1 | 12.8 | 12.1 | 11.9 | 11.8 |
| Unemployed, household head | 14.7 | 10.9 | 16.9 | 17.0 | 16.5 | 16.9 | 16.7 | 18.0 | 21.8 | 19.0 | 22.5 | 23.8 | 20.6 | 19.2 |
| Incomplete primary education, household head | 21.0 | 18.8 | 9.0 | 17.4 | 14.3 | 16.5 | 15.6 | 20.5 | 18.8 | 21.8 | 19.0 | 18.5 | 21.3 | 20.8 |
| Primary education, household head | 13.7 | 13.2 | 10.5 | 10.4 | 13.7 | 11.0 | 11.4 | 13.8 | 14.9 | 11.8 | 12.2 | 14.8 | 12.7 | 14.1 |
| Five-member family | 8.3 | 8.1 | 5.2 | 5.5 | 9.8 | 8.8 | 10.9 | 11.6 | 8.9 | 8.7 | 7.3 | 10.6 | 8.1 | 8.2 |
| Six-member and larger family | 17.3 | 14.4 | 10.0 | 13.7 | 14.3 | 12.7 | 10.1 | 14.0 | 15.4 | 15.8 | 12.1 | 15.2 | 9.8 | 7.9 |
| Children up to 13 | 11.6 | 11.2 | 7.3 | 9.7 | 11.9 | 9.7 | 9.4 | 10.4 | 10.5 | 9.9 | 8.4 | 9.1 | 7.6 | 8.2 |
| Children 14–18 | 11.7 | 8.8 | 6.9 | 8.3 | 7.9 | 9.0 | 9.7 | 8.8 | 9.9 | 10.6 | 8.5 | 10.6 | 8.2 | 8.5 |
Note: The absolute poverty line defined on the basis of the food line plus the sum of other expenditures (clothes, footwear, housing, health care, education, transport, recreation, culture, other goods and services), calculated in 2006, was increased by the amount of inflation (measured by the consumer price index) for each year. Source: HBS, SORS.
For more information on the poverty profile in Serbia, see:
- Assessment of Absolute Poverty in Serbia in 2019
- The Third National Report on Social Inclusion and Poverty Reduction in the Republic of Serbia for the Period 2014–2017
- Monitoring Social Inclusion in Republic of Serbia – Third Revised Edition
- Poverty in the Republic of Serbia for the Period 2006–2016 – Revised and New Data
- The Second National Report on Social Inclusion and Poverty Reduction in the Republic of Serbia
- Serbia – Income and Living Conditions
- Human Development Paper for Serbia
 Government of the Republic of Serbia





 pdf [271 KB]