Government of the Republic of Serbia

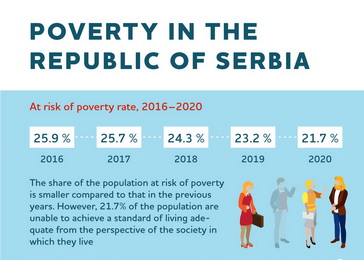
In 2019 (according to SILC 2020), the at-risk-of-poverty threshold or relative poverty line, calculated as 60% of the median equivalised income, amounted to, on average, RSD 22,000 per month for a single-person household, and RSD 46,200 for a four-person household with two adults and two children up to the age of 14. Expressed in purchasing power standards (PPS[1]), the at-risk-of-poverty threshold for a single-person household amounts to 330 PPS monthly.
The at-risk-of-poverty threshold in the Republic of Serbia is lower than the threshold in all 28 EU Member States and also in other Balkan countries (except North Macedonia and Albania)[2].
The table below shows alternative poverty lines and the sensitivity of the at-risk-of-poverty rate depending on the choice of poverty line. The percentage of change in the at-risk-of-poverty rate is higher than the percentage of change in the poverty line, indicating a considerable concentration of the population around the poverty line.
Raising the poverty line from 60% to 70% of the median equivalized income would increase the at-risk-of-poverty rate by 5.9 percentage points (from 21.7% to as high as 27.6%), while lowering the poverty line from 60% to 50% of the median equivalized income would decrease the at-risk-of-poverty rate by 7.6 percentage points (from 21.7% to 14.1%). The sensitivity of the at-risk-of-poverty rate did not change compared to the previous reporting period.
According to SILC (2020) data, the at-risk-of-poverty rate (share of persons with income by consumption unit below 60% of the median of the equivalent income in the total population) was 21.7%, and it represented the lowest at-risk-of-poverty rate in the observed survey implementation period.
Selected relative poverty indicators in the Republic of Serbia, 2013-2020
| % of median income by consumer unit | At-risk-of-poverty rate % | |||||||
| SILC 2013. | SILC 2014. | SILC 2015. | SILC 2016. | SILC 2017. | SILC 2018. | SILC 2019. | SILC 2020. | |
| 60% | 24,5 | 25,0 | 26,7 | 25,9 | 25,7 | 24,3 | 23,2 | 21,7 |
| 40% | 13,3 | 13,7 | 14,6 | 14,5 | 14,4 | 13,7 | 11,2 | 9,3 |
| 50% | 18,4 | 19,1 | 20,4 | 20,0 | 19,8 | 18,0 | 16,8 | 14,1 |
| 70% | 30,4 | 32,0 | 32,6 | 32,2 | 31,2 | 30,1 | 30,0 | 27,6 |
| % of median income by consumer unit | At-risk-of-poverty threshold, per month | |||||||
| SILC 2013. | SILC 2014. | SILC 2015. | SILC 2016. | SILC 2017. | SILC 2018. | SILC 2019. | SILC 2020. | |
| 60% | 13.680 | 13.725 | 13.973 | 14.680 | 15.600 | 16.615 | 19.381 | 22.000 |
| 40% | 9.120 | 9.150 | 9.316 | 9.787 | 10.400 | 11.076 | 12.921 | 14.667 |
| 50% | 11.400 | 11.438 | 11.644 | 12.233 | 13.000 | 13.846 | 16.151 | 18.334 |
| 70% | 15.960 | 16.013 | 16.302 | 17.127 | 18.200 | 19.384 | 22.611 | 25.667 |
Source: Eurostat database Table At-risk-of-poverty thresholds; At-risk-of-poverty rate by poverty threshold, age and sex.
Note:
-
Household income does not include in-kind income.
-
The reference period being the previous calendar year for income components.
The analysis of the profile of relatively poor persons indicates the following:
- Regarding sex, no significant differences are noted in the risk of poverty between men and women at the level of the overall population;
- Children (up to 18 years of age) are most at risk of poverty;
- Risk of poverty is significantly higher in rural areas;
- Those with lower levels of education are considerably more vulnerable;
- The unemployed are in the worst position, since nearly one in two unemployed persons (46.7%) are exposed to a risk of poverty;
- Individuals living in households with dependent children, and/or households with two adults with three or more dependent children, as well as single-parent families, have been most at risk of poverty according to SILC (2020) data.
Relative poverty profile, SILC 2013-2020
| SILC 2013. | SILC 2014. | SILC 2015. | SILC 2016. | SILC 2017. | SILC 2018. | SILC 2019. | SILC 2020. | |
| Total | 24,5 | 25,0 | 26,7 | 25,9 | 25,7 | 24,3 | 23,2 | 21,7 |
| Male | 24,9 | 25,6 | 27,5 | 26,3 | 25,4 | 24,6 | 22,7 | 21,3 |
| Female | 24,1 | 24,4 | 26,0 | 25,5 | 26,0 | 24,0 | 23,6 | 22,1 |
| Age | ||||||||
| Children (<18) | 29,7 | 29,3 | 31,1 | 30,2 | 30,5 | 28,8 | 28,9 | 24,2 |
| Adults 18-64 | 24,4 | 25,1 | 27,3 | 26,3 | 25,7 | 24,0 | 22,3 | 20,9 |
| 65 and over | 19,4 | 20,4 | 20,8 | 20,5 | 21,3 | 21,1 | 21,1 | 22,0 |
| Degree of urbanization | ||||||||
| Cities | 13,6 | 15,9 | 14,2 | 19,1 | 18,1 | 16,0 | 15,2 | 14,6 |
| Towns and suburbs | 23,5 | 21,9 | 24,3 | 21,8 | 21,8 | 20,4 | 19,0 | 18,1 |
| Rural areas | 36,1 | 37,5 | 36,7 | 34,1 | 35,2 | 34,7 | 33,5 | 30,7 |
| Household type | ||||||||
| Single-member household | 26,3 | 28,4 | 31,2 | 34,4 | 33,0 | 34,3 | 31,8 | 34,0 |
| One adult person with children | 34,2 | 33,8 | 37,5 | 40,8 | 30,6 | 36,5 | 41,6 | 31,9 |
| Two adult persons with 1 child | 24,9 | 19,4 | 22,6 | 21,5 | 26,4 | 24,1 | 23,9 | 18,4 |
| Two adult persons, 2 children | 24,6 | 26,4 | 28,2 | 24,2 | 24,8 | 21,3 | 19,1 | 18,2 |
| Two adult persons, 3 or more children | 44,4 | 35,2 | 34,2 | 53,1 | 55,8 | 53,6 | 51,9 | 37,2 |
| Households without dependent children | 21,3 | 22,4 | 23,7 | 22,9 | 22,8 | 21,2 | 19,8 | 21,0 |
| Households with dependent children | 27,0 | 27,0 | 29,1 | 28,2 | 28,0 | 26,8 | 26,1 | 22,3 |
| Education (18 and above) | ||||||||
| No education and primary (ED 0-2) | 36,5 | 38,6 | 42,5 | 40,7 | 41,6 | 42,1 | 41,1 | 40,7 |
| Secondary (ED 3 and 4) | 21,3 | 21,4 | 23,0 | 22,4 | 21,7 | 20,7 | 19,3 | 18,6 |
| Higher (ED 5 to 8) | 6,1 | 8,3 | 8,6 | 9,8 | 9,1 | 6,1 | 6,1 | 6,4 |
| Most frequent status in the labour market (18 and above) | ||||||||
| Employees | 6,4 | 7,0 | 8,0 | 7,8 | 6,8 | 6,8 | 6,5 | 6,2 |
| Employed persons except employees | 38,3 | 37,9 | 38,9 | 34,4 | 35,5 | 31,0 | 25,9 | 18,8 |
| Unemployed persons | 48,4 | 46,8 | 50,1 | 49,6 | 50,7 | 49,0 | 47,5 | 46,7 |
| Retired persons | 14,4 | 15,6 | 16,7 | 16,6 | 17,5 | 17,1 | 17,2 | 19,4 |
| Other inactive persons | 32,5 | 33,1 | 37,7 | 35,3 | 33,4 | 35,4 | 33,5 | 32,6 |
Source: Eurostat database Tables At-risk-of-poverty rate by poverty threshold, age and sex; At-risk-of-poverty rate by poverty threshold and household type; At-risk-of-poverty rate by poverty threshold and most frequent activity in the previous year; At-risk-of-poverty rate by degree of urbanization, At-risk-of-poverty rate by poverty threshold and educational attainment level.
Note: for all families, the term “children” means “dependent children”.
For more information on relative poverty in Serbia, see:
- The Third National Report on Social Inclusion and Poverty Reduction in the Republic of Serbia for the Period 2014–2017
- The Second National Report on Social Inclusion and Poverty Reduction in the Republic of Serbia
- Measuring Poverty – Theoretical Concepts, Status and Recommendations on Serbia
- Serbia – Income and Living Conditions
- Statistical Office of the Republic of Serbia – Poverty and Inequality, 2019
- Monitoring Social Inclusion in Republic of Serbia – Third Revised Edition
- Monitoring Social Inclusion in Republic of Serbia – Poverty and inequality indicators
- Monitoring Social Inclusion in Republic of Serbia – Material deprivation indicators
- Monitoring Social Inclusion in Republic of Serbia – Social and child protection indicators
- Monitoring Social Inclusion in Republic of Serbia – Social protection and welfare indicators
- Assessment of Absolute Poverty in Serbia in 2019
- Data on material deprivation for the EU and Serbia available at ec.europa.eu
—————