 The Social Inclusion and Poverty Reduction Unit of the Government of the Republic of Serbia (SIPRU) has analysed the effects of the one-off financial assistance to targeted categories of the population on the trends related to the poverty and inequality of income and consumption indicators. The analysis is based on the data taken from the Survey on Income and Living Conditions (SILC 2017) and the Household Budget Survey (HBS 2018). The data analysed from the SILC 2017 database refer to the population’s income, while the data from HBS 2018 refer to the population’s consumption.
Universal one-off financial assistance
To reduce the negative consequences of the COVID-19 pandemic on the well-being of the population, the Government of the Republic of Serbia provided assistance to all adult citizens through universal one-off financial assistance in the amount of EUR 100 (the payment was made in RSD). The implementation of this assistance is regulated by the Decree on the One-off Payment of EUR 100 to all Adult Citizens. According to the Ministry of Finance estimates, a total of 6,145,529 adult citizens received the universal one-off financial assistance, and this intervention required RSD 72.3 billion to be allocated from the national budget.[1]
Targeted one-off financial assistance
Targeted one-off financial assistance (TOFA) would target only specific vulnerable categories of the population, as opposed to the previously implemented universal one-off financial assistance, which was provided to all adult citizens. SIPRU conducted a simulation of the effects of four such measures, but in reality, only one of the four measures would be implemented. These four measures are:
- Measure 1 – Support to beneficiaries of social protection rights would refer to one-off financial assistance to:
a) households that are beneficiaries of financial social assistance (adults from the household would receive financial assistance in the amount of EUR 200, while minors would receive EUR 100),
b) households that are beneficiaries of the child allowance or increased child allowance (each minor in the household would receive EUR 100),
c) beneficiaries of the allowance or compensation for assistance and care of another person (financial assistance in the amount of EUR 200).
Within Measure 1, an individual would receive assistance only on one of the stated grounds.
- Measure 2 – Support to beneficiaries of social protection rights would refer to one-off financial assistance to:
a) households that are beneficiaries of financial social assistance (adults from the household would receive financial assistance in the amount of EUR 200, while minors would receive EUR 100),
b) households that are beneficiaries of the child allowance or increased child allowance (each minor in the household would receive EUR 100),
c) beneficiaries of the allowance or compensation for assistance and care of another person (financial assistance in the amount of EUR 200),
d) minors (EUR 100) living in households with two adults and three or more dependent children or in single-parent households (provided that the monthly income/consumption of a single-parent household does not exceed the amount of RSD 15,000 per equivalent adult, i.e. per consumption unit).
Within Measure 2, an individual would receive assistance only on one of the stated grounds.
- Measure 3 – Measure 3 would include assistance on the grounds stated in Measure 1, and also:
a) one-off financial assistance (EUR 200) to beneficiaries of disability pension, and
b) one-off financial assistance (EUR 100) to persons from elderly households[2] whose income/consumption does not exceed RSD 15,000 per equivalent adult, i.e. per consumption unit.
Within Measure 3, an individual would receive assistance only on one of the stated grounds.
- Measure 4 – Measure 4 would include assistance on the grounds stated in Measure 3, and also:
a) one-off financial assistance for minors (EUR 100) living in households with two adults and three or more dependent children or in single-parent households (provided that the monthly income/consumption of a single-parent household does not exceed the amount of RSD 15,000 per equivalent adult, i.e. per consumption unit).
Within Measure 4, an individual would receive assistance only on one of the stated grounds.
Targeted one-off financial assistance would be directly aimed at these vulnerable groups[3]. The allocations from the national budget would be significantly lower than the ones provided in 2020 for the implementation of the universal one-off financial assistance to all adult citizens (EUR 100).
The TOFA analysis implies consideration of costs, i.e. allocations for four proposed measures separately, along with the impact of TOFA on the change of basic indicators of poverty and inequality – at-risk-of-poverty rates, absolute poverty rates, Gini coefficient (according to income and according to consumption), quintile share ratio S80/S20 (according to income and according to consumption), the relative poverty risk gap, as well as the poverty gap.
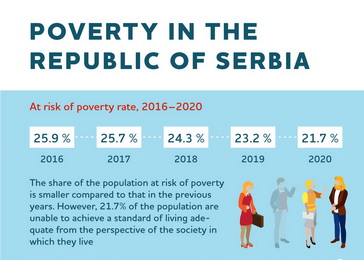
According to SILC data, the implementation of Measure 1, which would focus on providing financial assistance to social protection beneficiaries, would result in a decrease of the at-risk-of-poverty rate by 0.6 percentage points (from 25.7% to 25.1%). This type of assistance would reduce income distribution inequality so that the Gini coefficient would be 37.3, and the income quintile share ratio would be 8.7, compared to the official data for 2017, when the values of the mentioned indicators were 37.8 and 9.4, respectively. Observing the data from the HBS, the implementation of Measure 1 would reduce the absolute poverty rate from 7.1% as it was in 2018 to 6.5%[4]. The consumption Gini coefficient would be 28.2, and the consumption quintile share ratio would be 4.15. In 2018, these indicators were at 28.5 and 4.22. The poverty gap[5] would decrease by 15% compared to the official value of this indicator in 2018 (1.15). The mentioned measure can be implemented relatively easily, as it does not require additional administrative efforts, considering that the beneficiaries of financial social assistance, child allowance and allowance or compensation for assistance and care of another person are already registered in the social protection system and the Pension and Disability Insurance Fund of the Republic of Serbia. Significant effects on poverty and inequality indicators would be achieved if this measure were implemented twice a year (Measure 1A). Analysing the data from SILC, the at-risk-of-poverty rate, in this case, would be 24.2% compared to the post-universal financial assistance when it was 24.7%. This clearly shows that targeting the poorer part of the population can achieve better effects on poverty reduction with noticeably fewer budget allocations than in the case of universal one-off financial assistance for all adults.[6] According to the data on consumption from the HBS, with the application of Measure 1A, the quintile share ratio[7] would be 3.9 as opposed to the value of the quintile share ratio after the implementation of the universal financial assistance, which was 4.0. In other words, with less allocation from the national budget, the difference in the spending of the richest in relation to the poorest would decrease more if the financial assistance was targeted than if it was granted to all adult citizens.
The analysis of the effects of the measure related to support to social protection beneficiaries and minors living in single-parent households or households with two adults and three or more dependent children (Measure 2) shows similar values of relative poverty and income inequality indicators as the Measure 1 analysis (Table 1). A similar conclusion is obtained by analysing data from the HBS database – the application of Measure 2 and the application of Measure 1 (Table 2) have similar values related to absolute poverty and consumption inequality indicators.
Relative poverty and income inequality indicator trends, SILC 2017
| At-risk-of-poverty rate | Gini coefficient | Quintile share ratio | Poverty gap | |
| Official data for 2017 | 25.7 | 37.8 | 9.4 | 38.8 |
| Implemented measure of the Government of the RS | 24.7 | 36.5 | 8.2 | 36.1 |
| Measure 1 Simulation | 25.1 | 37.3 | 8.8 | 36.1 |
| Measure 1A Simulation | 24.2 | 36.9 | 8.3 | 35.7 |
| Measure 2 Simulation | 25.1 | 37.3 | 8.7 | 36.1 |
| Measure 3 Simulation | 25.0 | 37.2 | 8.7 | 36.2 |
| Measure 4 Simulation | 25.0 | 37.2 | 8.7 | 36.3 |
Source: SIPRU calculation based on SILC 2017 data; Statistical Office of the Republic of Serbia
Absolute poverty and consumption inequality indicator trends, HBS 2018
| Absolute poverty rate | Gini coefficient | Quintile share ratio | Poverty gap | |
| Official data for 2018 | 7.1 | 28.5 | 4.2 | 1.2 |
| Implemented measure of the Government of the RS | 4.1 | 27.5 | 4.0 | 0.8 |
| Measure 1 Simulation | 6.5 | 28.2 | 4.2 | 1.0 |
| Measure 1A Simulation | 6.1 | 28.0 | 3.9 | 0.9 |
| Measure 2 Simulation | 6.4 | 28.2 | 4.2 | 1.0 |
| Measure 3 Simulation | 6.0 | 28.2 | 4.1 | 0.9 |
| Measure 4 Simulation | 5.9 | 28.1 | 4.1 | 0.9 |
Source: SIPRU calculation based on HBS 2018 data; Statistical Office of the Republic of Serbia
A measure that would refer to financial assistance to persons with disabilities and elderly households also has a significant effect on the development of the values of poverty and income inequality indicators (Measure 3). This measure would provide assistance to beneficiaries of social protection, beneficiaries of disability pensions (assistance in the amount of EUR 200), as well as elderly households with low monthly incomes[8] (EUR 100 per household member). Data from SILC show that this type of intervention would lead to a decrease of the at-risk-of-poverty rate by 0.7 percentage points and a more even distribution of income in society compared to the official data from 2017. The observation is similar if the data from the HBS are considered, where after the implementation of Measure 3, the absolute poverty rate would decrease by 1.1 percentage points. However, unlike Measure 1, in the case of the implementation of Measure 3, additional administrative efforts would be needed to record elderly households whose income per equivalent adult is below RSD 15,000 per month.
Measure 4 would cover all the vulnerable population groups that appear in Measures 1-3. The analysis of the effects of the application of Measure 4 indicates similar changes in the values of the indicators of relative poverty and income inequality as with the previous measure (Measure 3). With the implementation of Measure 4, the absolute poverty rate would be 5.9%. In other words, with the implementation of Measure 4, the number of the absolutely poor would decrease by almost 17%. Roughly speaking, if the current number of the absolutely poor in Serbia is 490,000, after the implementation of Measure 4, this number would be 406,700.
Table 3 shows the potential allocation from the national budget for each simulated measure individually. In 2020, the Republic of Serbia allocated RSD 72.3 billion for the implementation of the universal one-off financial assistance.
Allocations from the budget of the Republic of Serbia, in billions of RSD
| Targeted one-off financial assistance (measure simulation) | Allocations (SILC) | Allocations (HBS) |
| Measure 1 | 8.8 | 4.8 |
| Measure 1A | 17.6 | 9.6 |
| Measure 2 | 9.5 | 5.9 |
| Measure 3 | 14.9 | 6.9 |
| Measure 4 | 15.6 | 8.1 |
Source: SIPRU calculation based on SILC 2017 and HBS 2018 data; Ministry of Finance
The analysis conducted by SIPRU shows how targeted one-off financial assistance can significantly increase the efficiency of assistance compared to the universal one-off financial assistance implemented during 2020. According to SILC data, Measure 1A is over four times “cheaper” than the implemented universal financial assistance and achieves approximately the same results in terms of reducing relative poverty and income inequality. A similar conclusion can be reached for other measures simulated by this research. The differences in efficiency are significantly more prominent if the data from the HBS are observed. Finally, the question can be raised about the effectiveness of targeted one-off financial assistance – what would be the effects on the indicators of poverty and inequality if the targeted assistance were allocated the same funds as the implemented universal financial assistance.
Download the documents:
- Effects of the targeted one-off financial assistance on trends related to the poverty and inequality indicators (.pdf)
- Effects of the targeted one-off financial assistance on trends related to the poverty and inequality indicators (.doc)
———–
[1] Additional information on the analysis of the mentioned universal one-off financial assistance on the poverty and inequality of income and consumption indicators is available here.
[2] Elderly households are single-member or multi-member households in which all members are over 65 years of age.
[3] Financial social assistance beneficiaries, child allowance and/or increased child allowance beneficiaries, persons with disabilities, elderly households and children from single-parent household with low monthly income or consumption, as well as families with two adults and three or more children.
[4] The assumption is that the entire targeted financial assistance will be used for consumption, which is a realistic assumption in the case of the poorer part of the population.
[5] The poverty gap (depth) shows how far off the poor population’s consumption is from the poverty line. The total deficit (gap) indicates the amount of funds required, assuming perfect targeting, to raise all poor individuals’ consumption/income to the level of the poverty line.
[6] Decree on the Establishment of a Temporary Register and the Manner of Payment of One-off Financial Assistance to all Adult Citizens of the Republic of Serbia in Order to Reduce the Negative Effects Caused by the COVID-19 Pandemic Caused by the SARS-CoV-2 Virus
[7] The quintile share ratio is a measure of inequality that shows the relative position of the population with the lowest equivalised consumption in relation to the population of the highest equivalised consumption – by comparing the consumption of 20% of the richest and 20% of the poorest population.
[8] See the section containing the description of simulated measures.
 Government of the Republic of Serbia








 pdf [271 KB]
Leave a Comment