The Government of the Republic of Serbia is strongly committed to monitoring and improving policies aimed at social inclusion and poverty reduction. Having in mind the perspective of European Union accession, Serbia started conducting the Survey on Income and Living Conditions in 2013, representing one of the main data sources in the European Union for monitoring the achievement of such goals. According to the Survey, 24.5% of the population in Serbia (or just under 1.8 million people) were at risk of poverty. At the same time, the country registered large differences in living standards. Detailed information of such geographic differences is useful for drafting adequate public policies and programmes to support economic growth, open jobs and effect social inclusion.
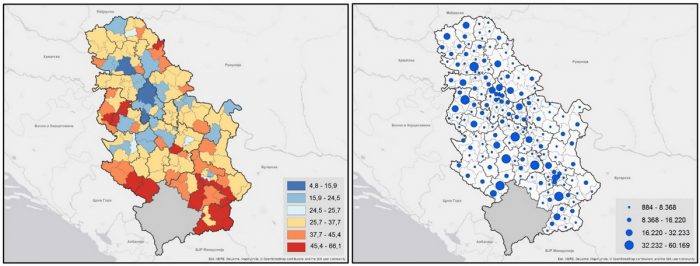
The Statistical Office of the Republic of Serbia (SORS) and World Bank drafted a set of poverty maps in Serbia, showing welfare disparities across the country. These maps unify data from the Population Census implemented in 2011 and the Survey on Income and Living Conditions implemented in 2013, enabling the assessment of the at-risk-of-poverty rates for small geographic areas, such as regions and countries. The mapping of poverty uses several input techniques, along with data from the above two sources, to assess poverty for small geographic areas, which in itself could not be achieved reliably using survey data only. The results (Figure 1) show that several municipalities in the south of Serbia have a high at-risk-of-poverty rate. The assessed at-risk-of-poverty rate ranges from 4.8% in Novi Beograd, in the Belgrade region, up to 66.1% in Tutin, in the region of Šumadija and Western Serbia. Even within the same region, e.g. the region of Southern and Western Serbia, the rate ranges from over 13% in Medijana to over 63% in Bojnik. Some regions with high at-risk-of-poverty rates also have a large number of poor citizens, therefore many poor people live in densely populated parts of the country.
Figure 1: At-risk-of-poverty rate (left) and number of persons at risk of poverty (right), Serbia, 2011

Source: World Bank and SORS assessments based on the 2011 Population Census and the 2013 Survey on Income and Living Conditions, collected by SORS. Note: At-risk-of-poverty rate is defined in accordance with the European Union standard of 60% of the mean income per adult equivalent.
Poverty maps are usually used along with other information when drafting public policy, including familiarity with the situation at the local level. Poverty maps are useful because they make it possible to precisely pinpoint geographic variations, to indicate areas developing at a slower rate, and at the same time to show various dimensions of welfare, as well as to understand poverty determinants. They not only raise awareness of poverty and have an impact on strengthening responsibility, but also potentially contribute to an improved allocation of resources and their better focus on geographic areas. Once a given area or population are determined to be in the most unfavourable position, it is important to include local-level expertise in the analysis to comprehend the causes that may differ from place to place, and thus formulate the most adequate recommendations for adopting public policy.
Click here to download the publication “Poverty Map in Serbia”
 Government of the Republic of Serbia


 pdf [271 KB]
Leave a Comment