Poverty level is determined by: (1) the chosen poverty line, (2) average consumption/income in the country (a function of Serbia’s development level, i.e. GDP per capita) and (3) consumption/income distribution among citizens. The latter issue boils down to (in)equality among citizens, and in the case of Serbia, consumption/income (in)equality.
The measurement of inequality is a complex area, encumbered with numerous difficulties in methodology and data collection. The two most straightforward and clearest indicators of (in)equality are: Gini coefficient and the quintile share ratio S80/S20 (the ratio of the consumption/income of the richest quintile to that of the poorest quintile).
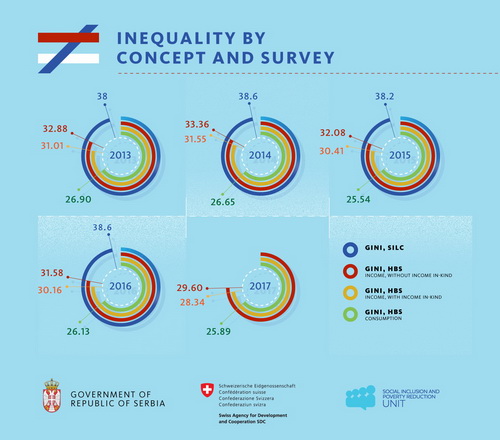
Below are the data on inequality in Serbia, both by income and by consumption, which indicate considerably different levels of inequality in the country. The consumption concept places Serbia among countries with a relatively even consumption distribution, by global standards, while the income concept indicates significant inequality and places Serbia among the countries with the least equality in the distribution of income in Europe.
The Gini coefficient measures inequality in the population as a whole; it takes values from 0 to 1 (0-100%), where 0 indicates full consumption/income equality of all individuals, and 1 indicates the concentration of all consumption/income in one individual.
The quintile share ratio S80/S20 compares the total equivalised consumption/income of the top quintile to that of the bottom quintile. The top quintile comprises 20% of the population with the highest equivalised consumption/income, and the bottom quintile 20% of the population with the lowest equivalised consumption/income. Thus defined, the indicator measures only the changes in the top and bottom quintiles of the equivalised consumption/income distribution.
Inequality under the Income Concept
The income distribution by deciles shows that according to SILC (2018) data, the poorest 10% of the population of the Republic of Serbia participates with only 0.8% in the national equivalent income, while the richest 10% participates with 24.6%.
Income distribution by deciles, share of the national equivalent income (%)
| 2013. | 2014. | 2015. | 2016. | 2017. | 2018. | |
| First decile | 1.4 | 1.0 | 0.8 | 0.5 | 1.0 | 0.8 |
| Tenth decile | 27.1 | 26.7 | 28.1 | 28.0 | 26.5 | 24.6 |
Source: Eurostat database Table Distribution of income by quantiles
Income inequality in the Republic of Serbia is very high, both according to the quintile ratio indicator (S80/S20), and the Gini coefficient.
According to SILC (2017) data, the inequality of income distribution was 9.4, meaning that the richest 20% in the Republic of Serbia had a nearly 10 times higher equivalent income than the poorest 20%. The value of this indicator measured in recent years was substantially higher than the average for the 28 EU Member States, amounting to just 5.08, but also higher than the highest values registered in Bulgaria (8.2), Romania (6.5) and Lithuania (7.3).
The Gini coefficient measures inequality across the entire income distribution. The Gini coefficient in the Republic of Serbia was 35.6 based on SILC (2018) data. According to these data, Serbia is in the group of countries with the highest inequality, Serbia shares its “place on the list” with Latvia (35.6), while a slightly higher inequality was observed in Lithuania (36.9), followed by Bulgaria (39.6).
The value of the quintile share ratio indicator did not change significantly during the observed period. On the other hand, the value of the Gini coefficient has been gradually declining since 2015, when according to the survey it was 40.0 (SILC 2015).
Gini coefficient and income quintile share ratio (according to income) in Serbia
| SILC 2013 | SILC 2014 | SILC 2015 | SILC 2016 | SILC 2017 | SILC 2018 | |
| Gini coefficient | 38.0 | 38.3 | 40.0 | 39.8 | 37.8 | 35.6 |
| Income quintile share ratio | 8.6 | 9.4 | 10.7 | 11.0 | 9.4 | 8.58 |
Source: Eurostat database Tables Gini coefficient of equivalised disposable income; S80/S20 income quintile share ratio by sex and selected age group
Special processing of the data from the Household Budget Survey (HBS) indicates that the value of the Gini coefficient of income distribution did not change compared to the first reporting period[1] and that in 2017 it is 28.3.
Judging by this survey, income inequality in Serbia did not increase since 2006. Mijakovac[2] notes that the differences in the values of the Gini coefficient based on the two surveys are due to the SILC survey in Serbia registering negative values of income for self-employed persons, while the HBS survey does not record losses.
Inequality under the Consumption Concept
The consumption-based Gini coefficient has low values in Serbia – it is near the bottom of the global list, implying that consumption inequality is quite moderate in Serbia and places Serbia among countries with relatively equal distributions of consumption. Similarly, the other inequality indicator – the consumption quintile share ratio also records a relatively low value in Serbia compared to other countries, indicating that consumption inequality is not particularly pronounced in Serbia, i.e. that it is moderate by global standards.
Consumption-based Gini coefficient and consumption quintile share ratio in Serbia
| 2013. | 2014. | 2015. | 2016. | 2017. | 2018. | |
| Gini coefficient | 26.9 | 26.6 | 25.5 | 26.1 | 25.9 | 28.45 |
| Income quintile share ratio | 4.0 | 3.9 | 3.7 | 3.9 | 3.8 | 4.2 |
Source: HBS, SORS.
Inequality measured by the Gini coefficient according to various surveys and definitions
| 2006. | 2007. | 2008. | 2009. | 2010. | 2011. | 2012. | 2013. | 2014. | 2015. | 2016. | 2017. | 2018. | |
| SILC | n/a | n/a | n/a | n/a | n/a | n/a | n/a | 38.0 | 38.3 | 40.0 | 39.8 | 37.8 | 35.6 |
| HBS, consumption concept | 27.94 | 27.10 | 26.05 | 26.24 | 27.03 | 25.38 | 26.76 | 26.90 | 26.65 | 25.54 | 26.13 | 25.89 | 28.45 |
| HBS, natural concept, with in-kind income | 32.91 | 31.96 | 30.17 | 29.47 | 29.96 | 29.17 | 29.76 | 31.01 | 31.55 | 30.41 | 30.16 | 28.34 | – |
| HBS, natural concept, without in-kind income | 35.36 | 34.05 | 32.14 | 31.23 | 31.27 | 32.09 | 32.16 | 32.88 | 33.36 | 32.08 | 31.58 | 29.60 | – |
For more information on inequality in Serbia, see:
- Third National Report on Social Inclusion and Poverty Reduction in the Republic of Serbia for the Period 2014–2017
- Second National Report on Social Inclusion and Poverty Reduction in the Republic of Serbia
- Monitoring Social Inclusion in Republic of Serbia – Third Revised Edition
- Poverty in the Republic of Serbia for the Period 2006–2016 – Revised and New Data
- Assessment of Absolute Poverty in Serbia in 2019
- Monitoring Social Inclusion in Republic of Serbia – Poverty and inequality indicators
- Monitoring Social Inclusion in Republic of Serbia – Material deprivation indicators
- Monitoring Social Inclusion in Republic of Serbia – Social and child protection indicators
- Monitoring Social Inclusion in Republic of Serbia – Social protection and welfare indicators
- Serbia – Income and Living Conditions
- Data on inequality under the income concept available here
—————
 Government of the Republic of Serbia







 pdf [271 KB]