The headline indicator for monitoring the implementation of the Europe 2020 strategy in the sphere of social inclusion and poverty reduction is AROPE. It was formulated in 2010 as a new and expanded primary indicator of poverty and social exclusion, with the aim of statistically measuring the intangible aspects of poverty and exclusion from the labour market, in order to improve the evaluation of the multidimensional aspect of poverty and social exclusion, with indications that this indicator is a product of political compromise[1].
The indicator represents a combination of three indicators – the at-risk-of-poverty rate, the rate of severe material deprivation and the rate of very low work intensity, measuring deprivation and living standards based on three criteria: income, non-monetary expenditures and employment/work.
This indicator, “people at risk of poverty or social exclusion”, shows the proportion of the population which is:
- At risk of poverty after social transfers (people whose equivalised income is below 60% of the median equivalised income) and/or
- Severely materially deprived (people who, owing to a lack of financial means, cannot afford at least four of the following nine household material deprivation items: 1) adequate heating of a dwelling; 2) a one-week annual holiday; 3) a meal with meat or fish every other day; 4) facing unexpected expenses; 5) arrears on mortgage or rent, utility bills, hire purchase instalments or other loan payments; 6) a telephone; 7) a colour television set; 8) a washing machine; 9) a car) and/or
- Living in households with zero or very low work intensity (adults worked for fewer than 20% of the total number of months in which they could have worked during the reference period).
As this headline indicator represents a union of three different risk factors, different “risk combinations” may be calculated as well.
Although it would appear that the population exposed to all three risk factors (overlap of the three sets) is most vulnerable, it is worth noting that due to the definition of low work intensity the overlap cannot contain persons older than 60[2], even when they are without income and under extreme material deprivation. By its nature, the overlap contains a practically very low share of employed and self-employed persons, as well as members of their households. To better understand the problem of multiple grounds of vulnerability, certain authors then propose monitoring consistent poverty, i.e., the population simultaneously at risk of poverty and under extreme material deprivation.
According to SILC (2019) data, 31.7% of the population of the Republic of Serbia (2.19 million) is at risk of poverty or social exclusion. This value is significantly higher than the average value for the EU 28 countries (21.4%); however, higher values of this indicator were recorded in Bulgaria, Albania, North Macedonia and Turkey[3].
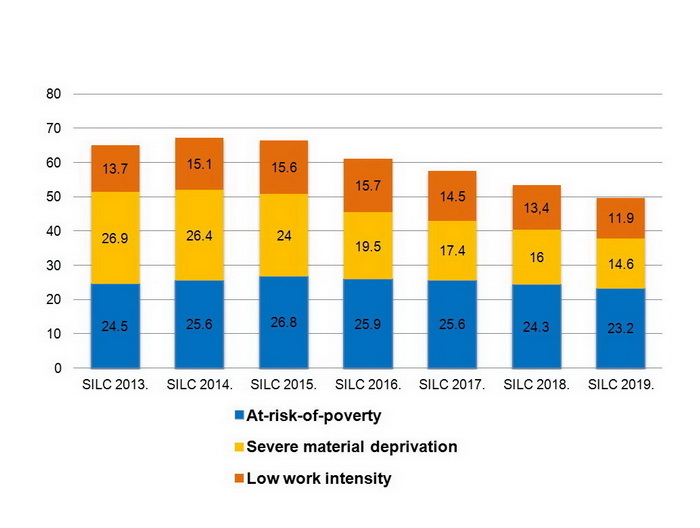
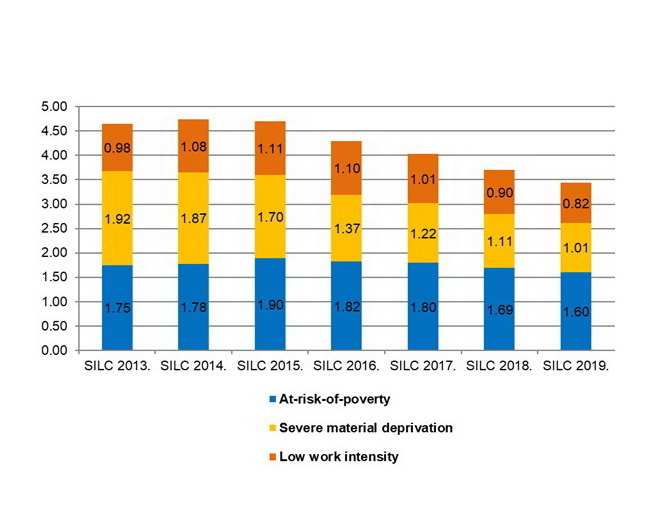
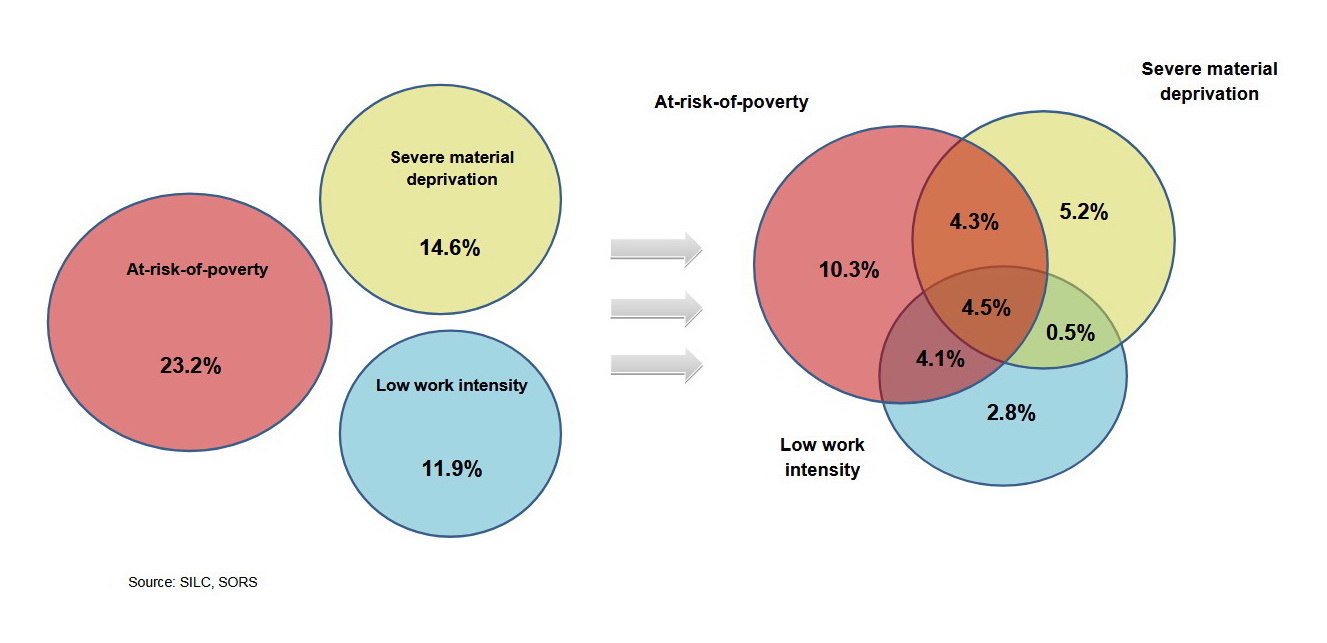
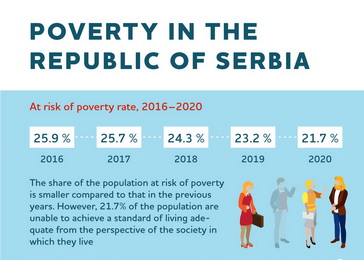
Broken down by risk factors, a total of 23.2% (1.60 million) of the population of the Republic of Serbia is at risk of poverty, 14.6% (1.01 million) is severely materially deprived, and 11.9% live in households with low work intensity (823 thousand).
Approximately 40% of the population exposed to a risk of poverty or social exclusion faces a combination of two or three risk factors, i.e., they are found at the intersection of two or three sets. The lowest overlap is between sets related to low work intensity and extreme material deprivation.
Formation of the at-risk-of-poverty rate or social exclusion rate in the Republic of Serbia, 2019, %
Note: The reference period for the collected data pertaining to:
– income is 12 months in the preceding calendar year – 2018,
– material deprivation is the time of the survey – 2019.
Persons at-risk-of-poverty or social exclusion
(left chart: share in total population; right chart: number of persons in millions).
 |
 |
| SILC 2013. | SILC 2014. | SILC 2015. | SILC 2016. | SILC 2017. | SILC 2018. | SILC 2019. | ||
| At risk of poverty | % | 24.5 | 25.6 | 26.8 | 25.9 | 25.6 | 24.3 | 23.2 |
| thousands | 1,750 | 1,778 | 1,895 | 1,820 | 1,795 | 1,690 | 1,604 | |
| Severe material deprivation | % | 26.9 | 26.4 | 24.0 | 19.5 | 17.4 | 16.0 | 14.6 |
| thousands | 1,922 | 1,873 | 1,701 | 1,374 | 1,221 | 1,107 | 1,010 | |
| Low work intensity | % | 13.7 | 15.1 | 15.6 | 15.7 | 14.5 | 13.4 | 11.9 |
| thousands | 975 | 1,084 | 1,106 | 1,104 | 1,014 | 902 | 823 | |
| Cross section of the At-risk-of-poverty rate and severe material deprivation | % | 6.7 | 6.2 | 6.2 | 5.1 | 4.9 | 4.7 | 4.3 |
| thousands | 482 | 439 | 438 | 358 | 344 | 326 | 299 | |
| Cross section of the At-risk-of-poverty rate and low work intensity | % | 2.8 | 3.4 | 4.8 | 5.3 | 5.7 | 5.5 | 4.1 |
| thousands | 199 | 244 | 340 | 373 | 399 | 382 | 284 | |
| Cross section of the severe material deprivation and low work intensity | % | 1.7 | 2.2 | 1.5 | 1.0 | 0.9 | 0.5 | 0.5 |
| thousands | 122 | 159 | 104 | 70 | 61 | 33 | 38 | |
| Cross section of all three indicators | % | 5.9 | 6.0 | 6.1 | 5.6 | 4.7 | 4.1 | 4.5 |
| thousands | 419 | 428 | 432 | 394 | 331 | 284 | 310 | |
Source: SILC, SORS
For more information, see:
- The Third National Report on Social Inclusion and Poverty Reduction in the Republic of Serbia for the Period 2014–2017
- The Second National Report on Social Inclusion and Poverty Reduction in the Republic of Serbia
- Measuring Poverty – Theoretical Concepts, Status and Recommendations on Serbia
- Monitoring Social Inclusion in Republic of Serbia – Third Revised Edition
- AROPE data for the EU and Serbia are available at ec.europa.eu
—————
 Government of the Republic of Serbia







 pdf [271 KB]