Government of the Republic of Serbia

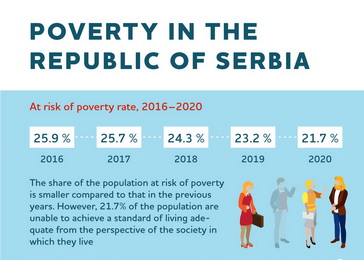
Given that the relative poverty concept is not entirely adequate for monitoring the development of the at-risk-of-poverty rate over time, absolute poverty should be monitored on an ongoing basis according to the current methodology (based on household consumption and absolute poverty line). Monitoring absolute poverty is important not just from the aspect of monitoring the dynamics of the number of the impoverished, but also for formulating public policies to reduce poverty.
Whether one is absolutely poor or not is established by comparing one’s consumption, or consumption per equivalent adult, with the absolute poverty line. The absolute poverty line is defined as fixed consumption required to satisfy minimum needs, adjusted over time only for changes in prices. Equivalent adult is defined according to the OECD scale (weight assigned to the first adult household member = 1, other adults = 0.7, children under 14 = 0.5).
According to data from the European Statistics Agency – Eurostat, the Statistical Office of the Republic of Serbia changed its data processing methodology for creating personal consumption in 2016[1]. In order to secure methodologically harmonized data series, during 2017, the Social Inclusion and Poverty Reduction Unit of the Government of the Republic of Serbia in cooperation with the Statistical Office of the Republic of Serbia published the revised data on absolute poverty for the period 2006-2016. Since then, annual data have been published in October of each year, month during which the International Day for the Eradication of Poverty is marked. The latest data can be downloaded along with a brief Assessment of Poverty.
Data on absolute poverty trends based on data from the HBS indicate that in the Republic of Serbia in 2019, approximately 480 thousand people or 7.0% of the total population number, cannot meet their daily needs. The absolute poverty rate decreased slightly during the observed reporting period, despite remaining somewhat above the value during the period 2008-2012. A single-member household with consumption under RSD 12,495 is beneath the poverty line. In case of a four-person family with two children under the age of 14, the line is RSD 33,172.
Data indicates that the most vulnerable population outside urban areas, particularly in Central Serbia, are children up to 14 years of age, youth (15-24 years), persons living in households with uneducated persons or persons with low education, unemployed, and inactive heads of households.
⇒ Complete Absolute Poverty Profile for the period 2006-2019, in Excel format, is available at the following link.
Absolute poverty profile, 2006–2019
| 2006. | 2007. | 2008. | 2009. | 2010. | 2011. | 2012. | 2013. | 2014. | 2015. | 2016. | 2017. | 2018. | 2019. | |
| Poverty line, RSD per month per equivalent adult | 6,221 | 6,625 | 7,401 | 8,022 | 8,544 | 9,483 | 10,223 | 11,020 | 11,340 | 11,556 | 11,694 | 12,045 | 12,286 | 12,495 |
| Percentage of the poor in the Republic of Serbia | 8.8 | 8.3 | 6.1 | 6.6 | 7.6 | 6.6 | 6.3 | 7.4 | 7.6 | 7.4 | 7.3 | 7.2 | 7.1 | 7.0 |
| Upper and lower limit of the 95% confidence interval (95% CI) | (7.6 – 10.1) | (7.0 – 9.5) | (5.0 – 7.1) | (5.5 – 7.8) | (6.4 – 8.8) | (5.5 – 7.7) | (5.2 – 7.4) | (6.2 – 8.6) | (6.6 – 8.5) | (6.5 – 8.4) | (6.3 – 8.3) | (6.1 – 8.3) | (6.0 – 8.2) | (6.1 – 8.0) |
| Poverty depth, % | 2.1 SE (0.23) |
1.9 SE (0.21) |
1.2 SE (0.13) |
1.5 SE (0.17) |
1.5 SE (0.18) |
1.1 SE (0.12) |
1.4 SE (0.18) |
1.6 SE (0.16) |
1.4 SE (0.12) |
1.2 SE (0.11) |
1.2 SE (0.13) |
1.1 SE (0.17) |
1.2 SE (0.12) |
1.1 SE (0.13) |
| Poverty severity, % | 0.8 SE (0.13) |
0.7 SE (0.11) |
0.4 SE (0.06) |
0.5 SE (0.08) |
0.5 SE (0.08) |
0.3 SE (0.05) |
0.5 SE (0.09) |
0.5 SE (0.08) |
0.4 SE (0.05) |
0.4 SE (0.05) |
0.4 SE (0.08) |
0.4 SE (0.09) |
0.4 SE (0.05) |
0.4 SE (0.06) |
| Percentage of the poor by regions | ||||||||||||||
| Region of Vojvodina | 8.7 | 11.9 | 6.8 | 4.9 | 5.9 | 6.2 | 6.1 | 5.2 | 6.8 | 6.5 | 6.3 | 6.2 | 6.0 | 6.0 |
| Belgrade region | 4.3 | 2.4 | 2.9 | 3.6 | 3.8 | 3.7 | 3.1 | 4.9 | 4.0 | 3.9 | 4.0 | 4.0 | 3.9 | 3.9 |
| Central Serbia (without the Belgrade region) | 10.7 | 9.0 | 7.0 | 8.8 | 10.1 | 7.9 | 7.7 | 9.8 | 9.6 | 9.6 | 9.3 | 9.1 | 9.1 | 9.0 |
| Region of Šumadija and Western Serbia | 10.2 | 7.6 | 4.0 | 3.9 | 5.7 | 5.4 | 4.5 | 6.3 | 6.7 | 6.6 | 6.6 | 6.8 | 6.8 | 6.9 |
| Region of Southern and Eastern Serbia | 11.4 | 10.7 | 10.7 | 15.0 | 15.5 | 11.3 | 11.8 | 14.7 | 13.5 | 13.1 | 12.8 | 12.1 | 11.9 | 11.8 |
| Percentage of the poor by settlement type | ||||||||||||||
| Urban area | 5.3 | 6.0 | 5.0 | 4.8 | 4.1 | 4.4 | 4.3 | 5.3 | 5.3 | 5.4 | 5.1 | 4.9 | 4.8 | 4.8 |
| Other areas | 13.3 | 11.2 | 7.5 | 9.0 | 12.1 | 9.4 | 8.7 | 10.5 | 10.9 | 10.5 | 10.5 | 10.5 | 10.4 | 10.3 |
| Proportion of the poor by sex | ||||||||||||||
| Male | 8.5 | 8.0 | 6.1 | 6.7 | 7.8 | 6.5 | 6.3 | 7.4 | 7.7 | 7.5 | 7.3 | 7.4 | 7.3 | 6.9 |
| Female | 9.1 | 8.5 | 6.0 | 6.5 | 7.4 | 6.7 | 6.3 | 7.4 | 7.5 | 7.4 | 7.3 | 7.0 | 7.3 | 7.2 |
| Percentage of the poor by household type | ||||||||||||||
| Single-person | 8.6 | 8.8 | 6.6 | 5.5 | 4.9 | 4.0 | 2.7 | 5.4 | 3.9 | 7.9 | 5.8 | 5.3 | 4.3 | 5.3 |
| Two-person | 8.7 | 9.2 | 5.5 | 5.2 | 4.4 | 5.3 | 3.3 | 5.7 | 5.8 | 6.7 | 7.3 | 5.5 | 8.1 | 6.3 |
| Three-person | 5.2 | 4.9 | 5.1 | 5.0 | 6.1 | 3.3 | 5.8 | 4.5 | 5.0 | 5.1 | 5.9 | 4.8 | 7.0 | 8.4 |
| Four-person | 5.7 | 5.3 | 4.7 | 4.3 | 5.3 | 5.0 | 4.7 | 4.5 | 6.0 | 3.9 | 5.6 | 4.1 | 4.9 | 6.1 |
| Five-person | 8.3 | 8.1 | 5.2 | 5.5 | 9.8 | 8.8 | 10.9 | 11.6 | 8.9 | 8.7 | 7.3 | 10.6 | 8.1 | 8.2 |
| Six-person and larger | 17.3 | 14.4 | 10.0 | 13.7 | 14.3 | 12.7 | 10.1 | 14.0 | 15.4 | 15.8 | 12.1 | 15.2 | 9.8 | 7.9 |
| Percentage of the poor by age | ||||||||||||||
| Children up to 13 | 11.6 | 11.2 | 7.3 | 9.7 | 11.9 | 9.7 | 9.4 | 10.4 | 10.5 | 9.9 | 8.4 | 9.1 | 7.6 | 8.2 |
| Children 14–18 | 11.7 | 8.8 | 6.9 | 8.3 | 7.9 | 9.0 | 9.7 | 8.8 | 9.9 | 10.6 | 8.5 | 10.6 | 8.2 | 8.5 |
| Adults 19–24 | 7.2 | 6.6 | 5.9 | 7.2 | 8.5 | 7.7 | 10.2 | 9.3 | 9.4 | 8.0 | 8.4 | 9.0 | 8.6 | 8.2 |
| Adults 25–45 | 8.4 | 7.4 | 5.0 | 6.0 | 7.5 | 6.1 | 5.8 | 6.6 | 7.2 | 7.0 | 6.4 | 6.0 | 5.6 | 5.7 |
| Adults 46-64 | 7.0 | 6.6 | 5.4 | 5.0 | 6.7 | 5.6 | 5.6 | 6.9 | 6.5 | 6.8 | 7.0 | 6.7 | 6.8 | 6.2 |
| The elderly 65+ | 10.0 | 10.3 | 7.5 | 7.1 | 6.2 | 6.1 | 4.4 | 6.4 | 6.5 | 8.9 | 7.4 | 7.0 | 7.9 | 8.0 |
| Percentage of the poor by educational attainment of household head | ||||||||||||||
| Incomplete primary education | 21.0 | 18.8 | 9.0 | 17.4 | 14.3 | 16.5 | 15.6 | 20.5 | 18.8 | 21.8 | 19.0 | 18.5 | 21.3 | 20.8 |
| Primary education | 13.7 | 13.2 | 10.5 | 10.4 | 13.7 | 11.0 | 11.4 | 13.8 | 14.9 | 11.8 | 12.2 | 14.8 | 12.7 | 14.1 |
| Secondary education | 5.5 | 5.4 | 4.8 | 3.6 | 4.7 | 3.7 | 3.3 | 4.5 | 4.8 | 5.6 | 5.5 | 4.4 | 5.0 | 4.6 |
| Non-university higher education | 0.6 | 0.1 | 2.7 | 2.0 | 2.8 | 2.5 | 1.6 | 2.0 | 0.7 | 2.5 | 2.5 | 2.3 | 2.2 | 1.2 |
| University-level higher education | 1.8 | 0.4 | 1.9 | 0.4 | 0.7 | – | 0.8 | 1.1 | 0.7 | 0.5 | 0.5 | 1.1 | – | 0.9 |
| Percentage of the poor by socio-economic status of household head | ||||||||||||||
| Self-employed | 10.2 | 10.9 | 5.1 | 5.5 | 8.8 | 6.3 | 5.5 | 8.1 | 9.7 | 10.1 | 8.4 | 6.4 | 6.6 | 5.8 |
| Employed | 5.2 | 5.3 | 3.9 | 4.4 | 6.0 | 4.0 | 4.0 | 3.6 | 3.2 | 3.4 | 2.8 | 3.5 | 3.1 | 2.7 |
| Unemployed | 14.7 | 10.9 | 16.9 | 17.0 | 16.5 | 16.9 | 16.7 | 18.0 | 21.8 | 19.0 | 22.5 | 23.8 | 20.6 | 19.2 |
| Pensioners | 8.8 | 7.6 | 5.7 | 5.8 | 5.8 | 5.9 | 4.2 | 6.3 | 6.3 | 6.2 | 6.3 | 6.8 | 7.4 | 8.1 |
| Other inactive | 28.2 | 24.2 | 15.5 | 29.3 | 15.5 | 16.2 | 24.6 | 22.4 | 16.6 | 21.7 | 20.4 | 13.8 | 23.6 | 32.7 |
Note: The absolute poverty line defined on the basis of the food line plus the sum of other expenditures (clothes, footwear, housing, health care, education, transport, recreation, culture, other goods and services), calculated in 2006, was increased by the amount of inflation (measured by the consumer price index) for each year.
Source: HBS, SORS.
For more information on absolute poverty, see:
- The Third National Report on Social Inclusion and Poverty Reduction in the Republic of Serbia for the Period 2014–2017
- Absolute Poverty Profiles 2006-2019 in Excel format
- Assessment of Absolute Poverty in Serbia in 2019
- Analysis of the Decile Distribution of the Income and Consumption in Serbia for the Period 2006-2018
- The Second National Report on Social Inclusion and Poverty Reduction in the Republic of Serbia
- Measuring Poverty – Theoretical Concepts, Status and Recommendations on Serbia
- Monitoring Social Inclusion in Republic of Serbia – Third Revised Edition
- Poverty in the Republic of Serbia for the Period 2006–2016 – Revised and New Data
- Monitoring Social Inclusion in the Republic of Serbia – Poverty and inequality
- Monitoring Social Inclusion in the Republic of Serbia – Material deprivation
- Monitoring Social Inclusion in the Republic of Serbia – Social and child protection
—————